App Overview
Internal Architecture – PA Measurement Flow
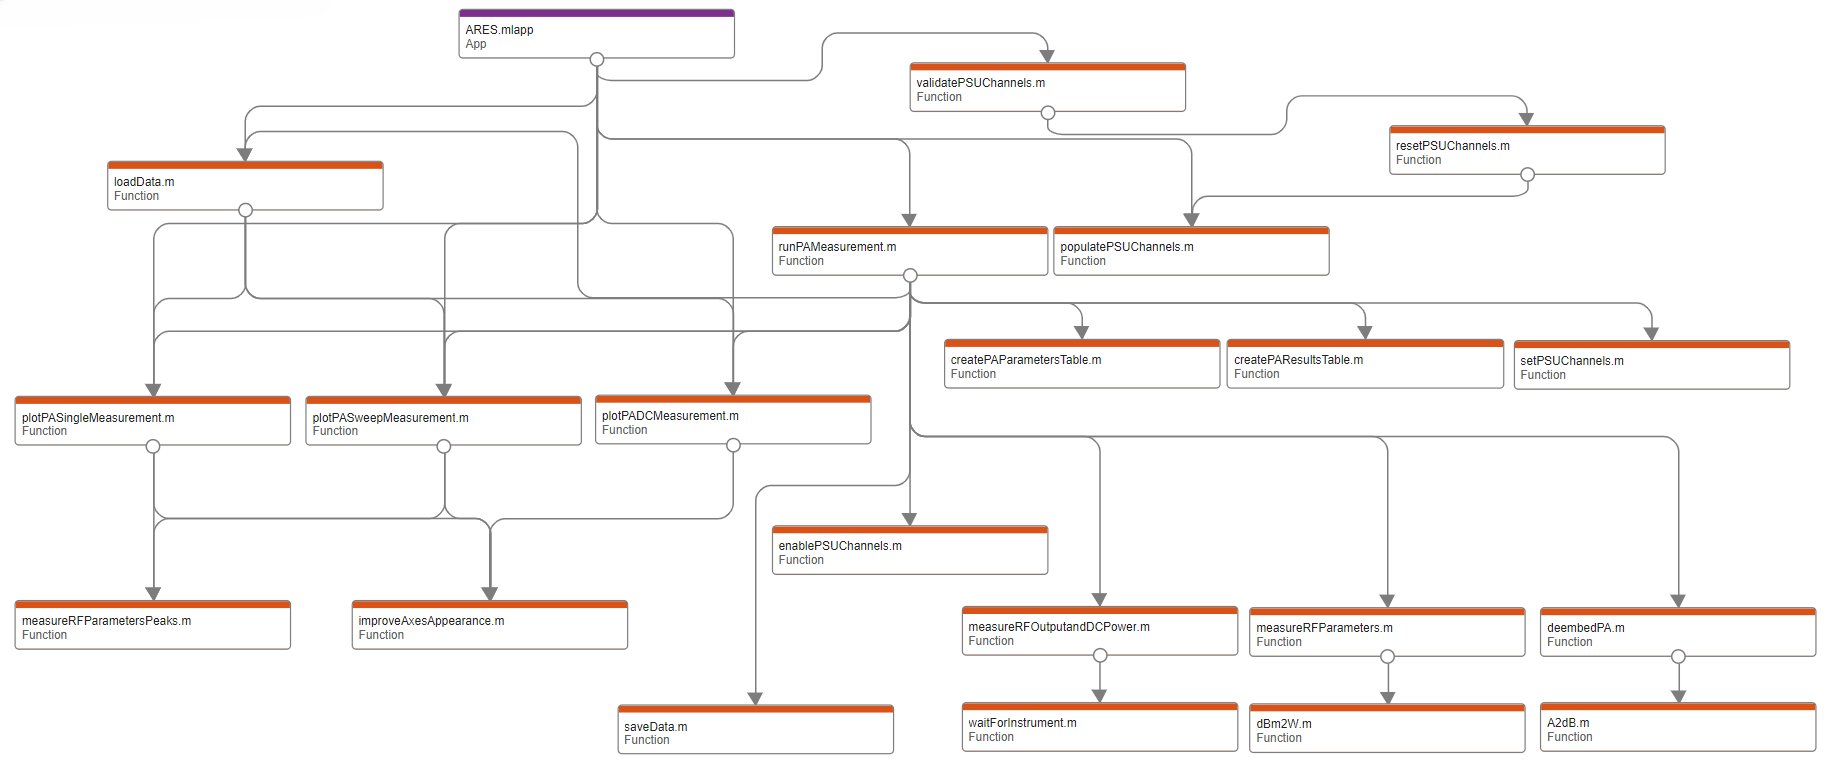
This diagram was generated using MATLAB’s Dependency Analyzer and shows the internal function call structure for the Power Amplifier (PA) module in ARES.
At the top level, ARES.mlapp connects to the main controller functions, like:
runPAmeasurement.m: The central function for a PA test.validatePSUChannels.mandpopulatePSUChannels.m: Used to configure the power supplies.loadData.m: Handles importing previously saved measurements.
From there, the process branches into:
DC supply handling:
enablePSUChannels.m,setPSUChannels.mData preparation:
createPAParametersTable.m,createPAResultsTable.mData capture and analysis:
measureRFParameters.m,measureRFParametersPeaks,measureRFOutputandDCPower.m, anddeembedPA.mPlotting and visualization:
plotPASingleMeasurement.m,plotPASweepMeasurement.m, andplotPADCMeasurement.mPlot enhancements:
improveAxesAppearance.m
All results are ultimately passed to saveData.m.
Internal Architecture – Antenna Measurement Flow
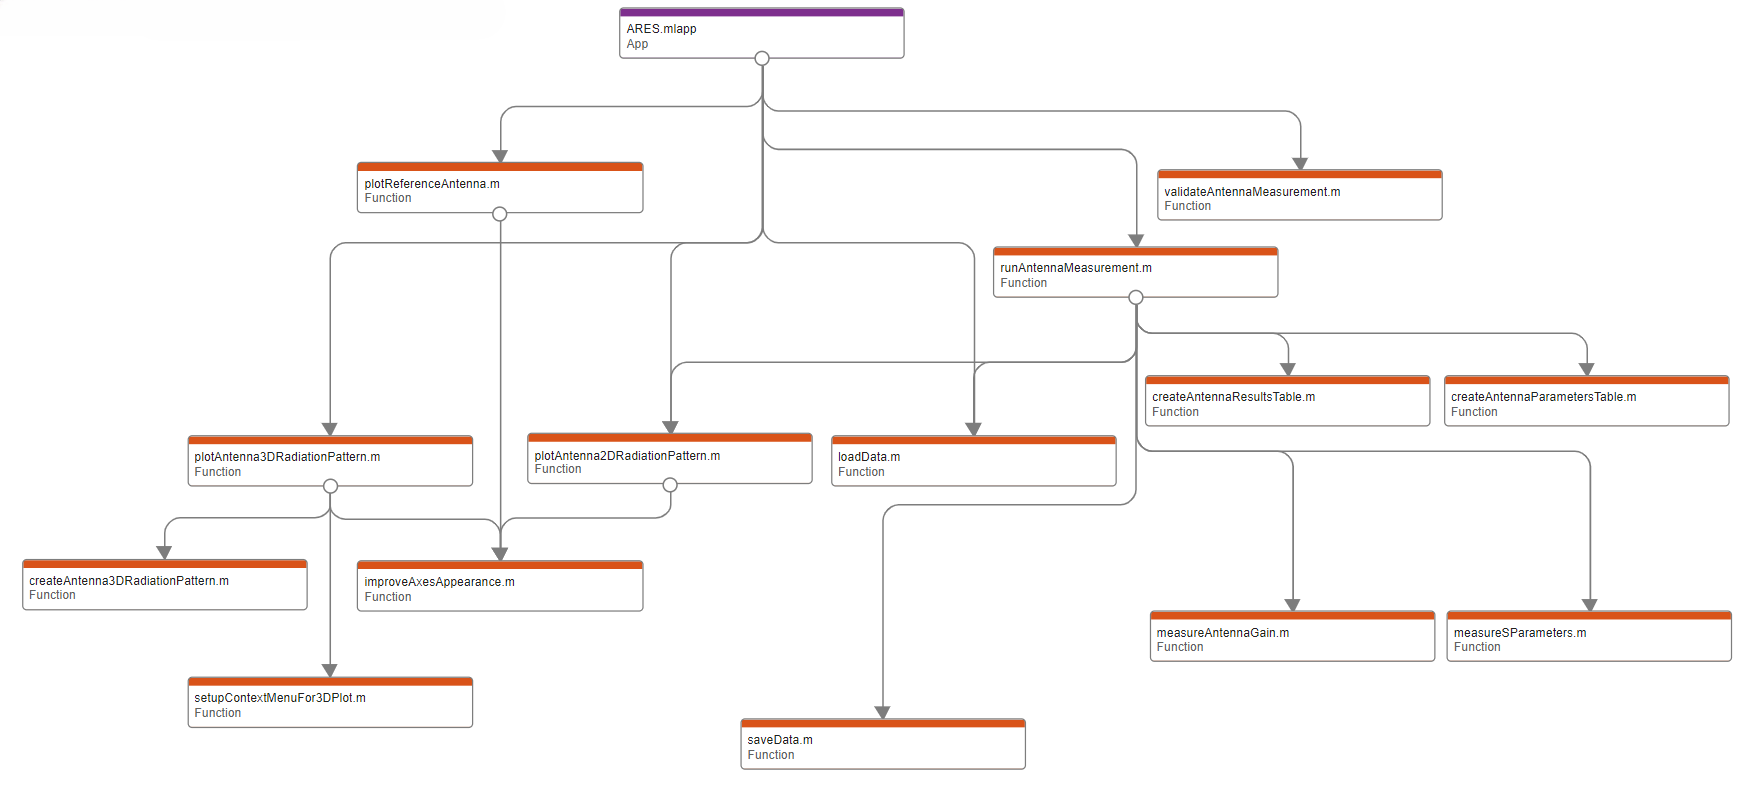
This diagram was generated using MATLAB’s Dependency Analyzer and shows the internal function call structure for the Antenna module in ARES.
At the top level, ARES.mlapp connects to the main controller functions, like:
runAntennaMeasurement.m: The central function for an antenna test.validateAntennaMeasurement: Used to validate the measurement parameters before running the test.loadData.m: Handles importing previously saved measurements.
From there, the process branches into:
Data preparation:
createAntennaParametersTable.m,createAntennaResultsTable.mData capture and analysis:
measureAntennaGain.m,measureSParametersPlotting and visualization:
plotReferenceAntenna.m,plotAntenna2DRadiationPattern.m,createAntenna3DRadiationPattern, andplotAntenna3DRadiationPattern.mPlot enhancements:
improveAxesAppearance.m,setupContextMenuFor3DPlot.m
All results are ultimately passed to saveData.m.