PA Tutorial
The Power Amplifier (PA) module performs parametric measurements by sweeping frequency, input RF power, and controlling up to four power supplies. The software captures measurements, calculates figures of merit (FoM), saves the data, and plots the results. You do not need to rerun the test every time, as previously saved data can be reloaded into the app.
Sample datasets are available in the data/PA folder.
Average Measurement Time
Less than 1 second per data point with the default measurement delay.
A data point corresponds to one combination of the parametric sweep, represented as a single row in the parameters and results table.
Theory
Gain and Efficiency
Drain Efficiency (DE):
Power Added Efficiency (PAE):
Gain:
Where,
\(P_{out}\): RF output power
\(P_{in}\): RF input power
\(P_{DC}\): DC supply (drain) power
Gain Compression Points
The gain compression points characterize the nonlinearity of a power amplifier (PA). These include:
1 dB Compression Point (\(P_{-1 dB}\)): Output power where gain drops by 1 dB from peak value.
3 dB Compression Point (\(P_{-3 dB}\)): Output power where gain drops by 3 dB from peak value.
Saturation Power (\(P_{sat}\)): Absolute maximum output power.
These refer to output-referred compression points, which are standard for PAs. In contrast, input-referred compression points may be used for linear or low-noise amplifiers. These figures of merit indicate the linearity of the device under test (DUT).
Calibration
Direct Measurement (Supported):
Fixed-level measurements.
Small-signal (passive) S-parameters.
Large-signal driver measurements.
Standard instrument connections support these calibration types directly through the ARES interface.
Indirect Measurement (Not Yet Supported):
Planned Feature: Support for coupled measurements using two signal analyzers—one measuring the input and the other measuring the output via directional couplers (e.g., -X dB).
This would enable real-time tracking of gain and distortion with a more accurate measurement path.
Performing the Measurement
Connect to the Instruments
Power supply selection is optional; however, omitting it will limit which FoMs can be calculated.
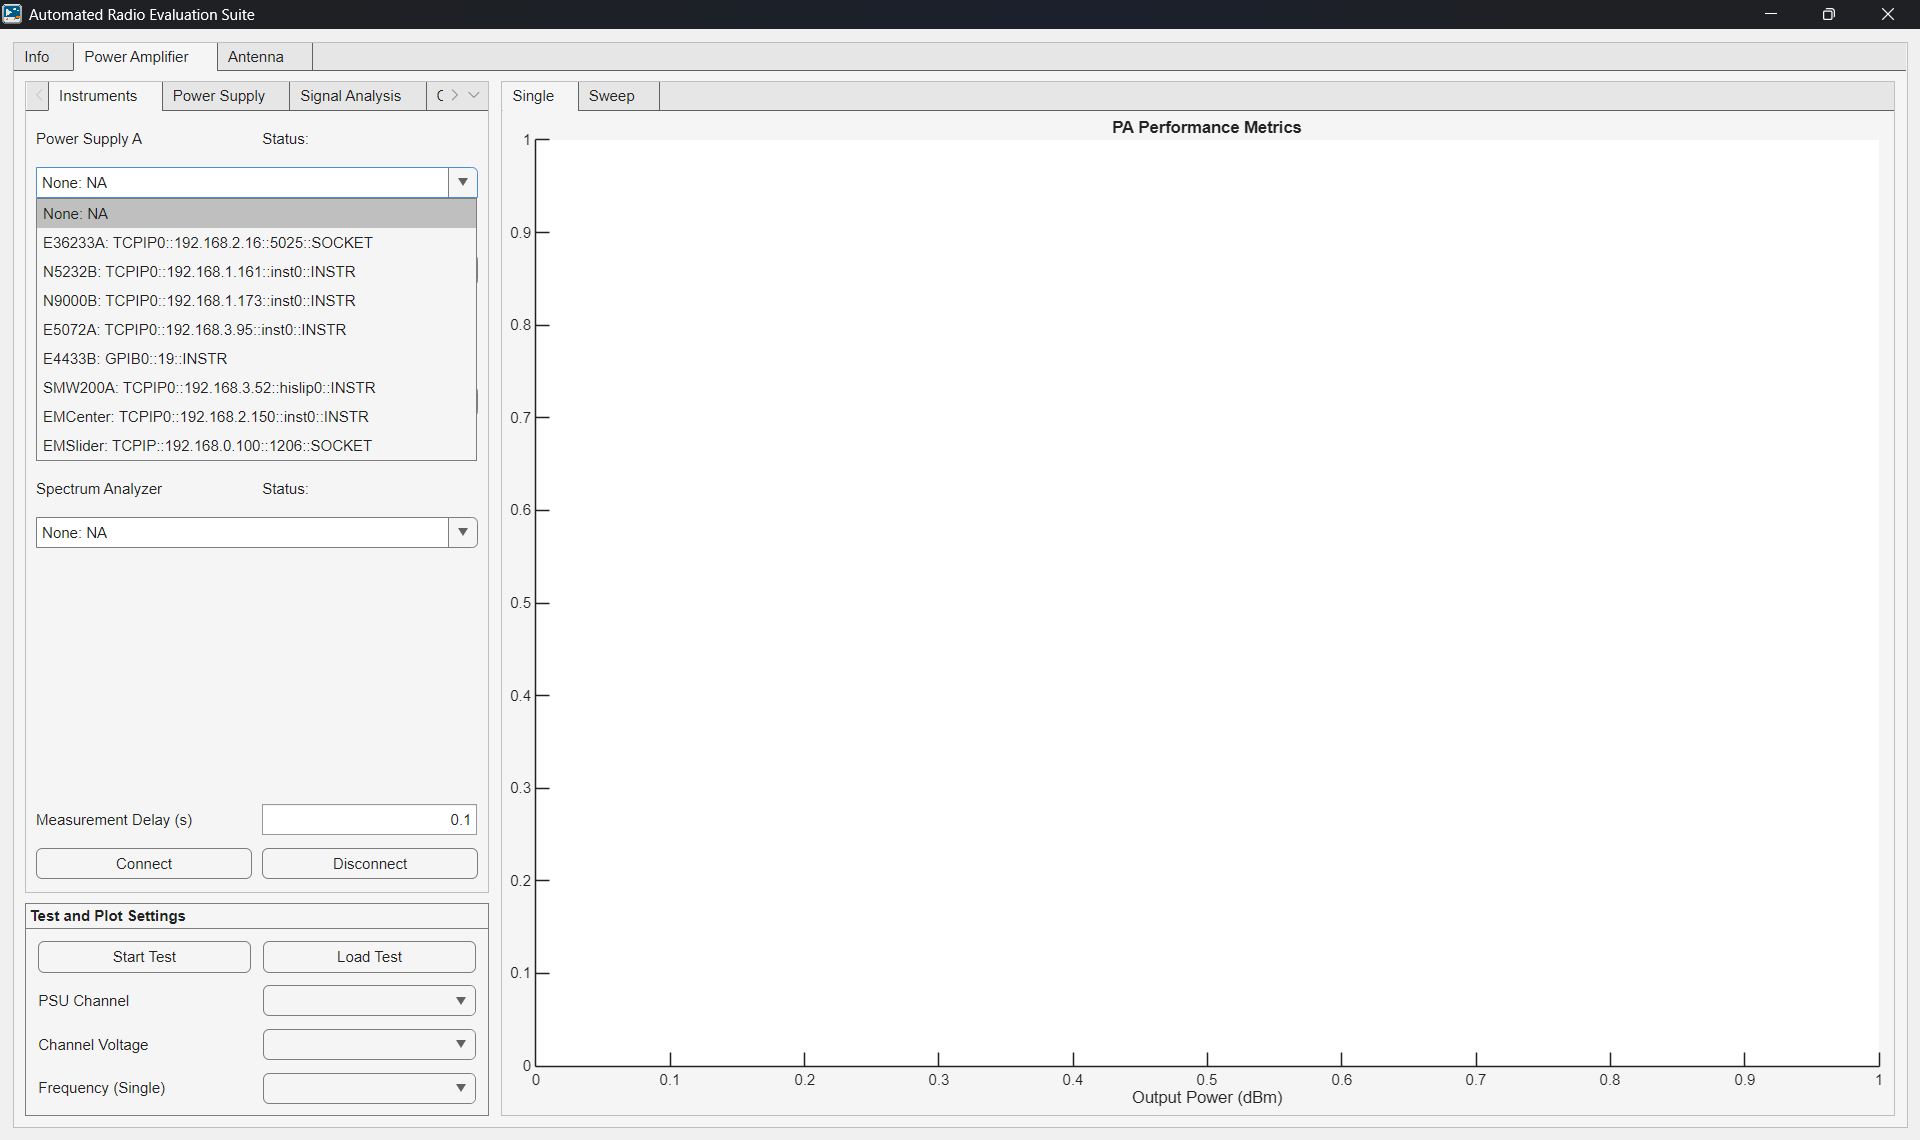
Select the relevant instrument VISA addresses in each dropdown of the Instruments tab.
Select None: NA for the instruments that will not be used.
Follow the Instrument Database Tutorial for detailed information on how to edit the user-defined instrument database.
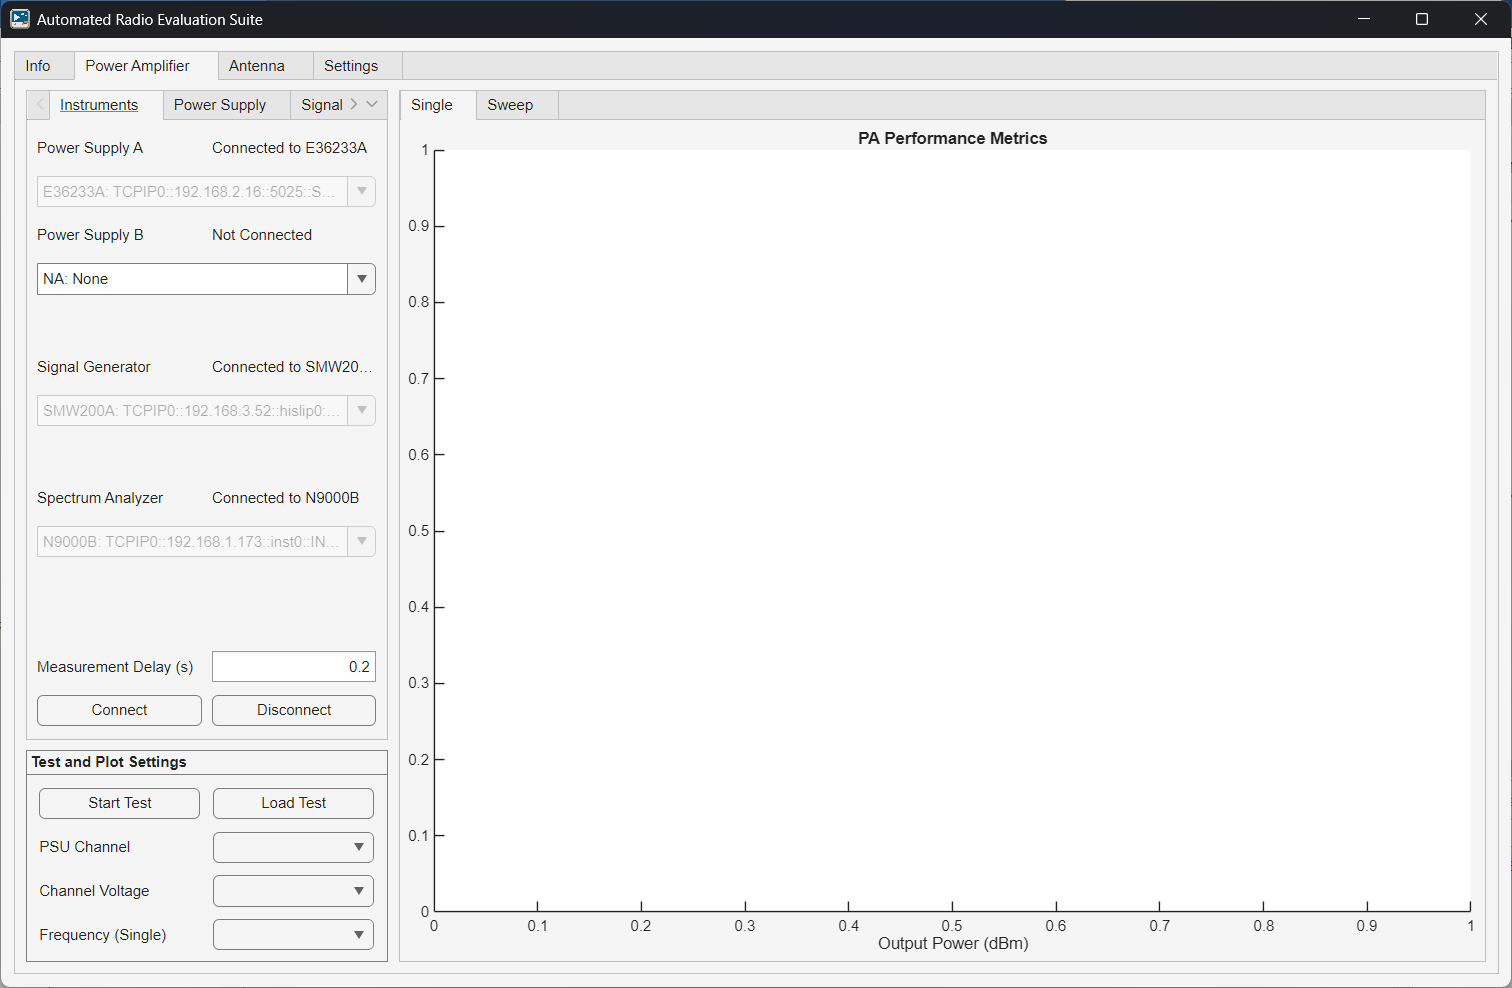
Once all relevant instrument addresses have been populated, click on Connect at the bottom to establish a connection to each instrument and Disconnect to clear all connections.
The Measurement Delay (s) can be modified at any time before the measurement starts. This value is the time in seconds to wait between setting all the instruments and capturing the data.
Configure the DC Power Supplies
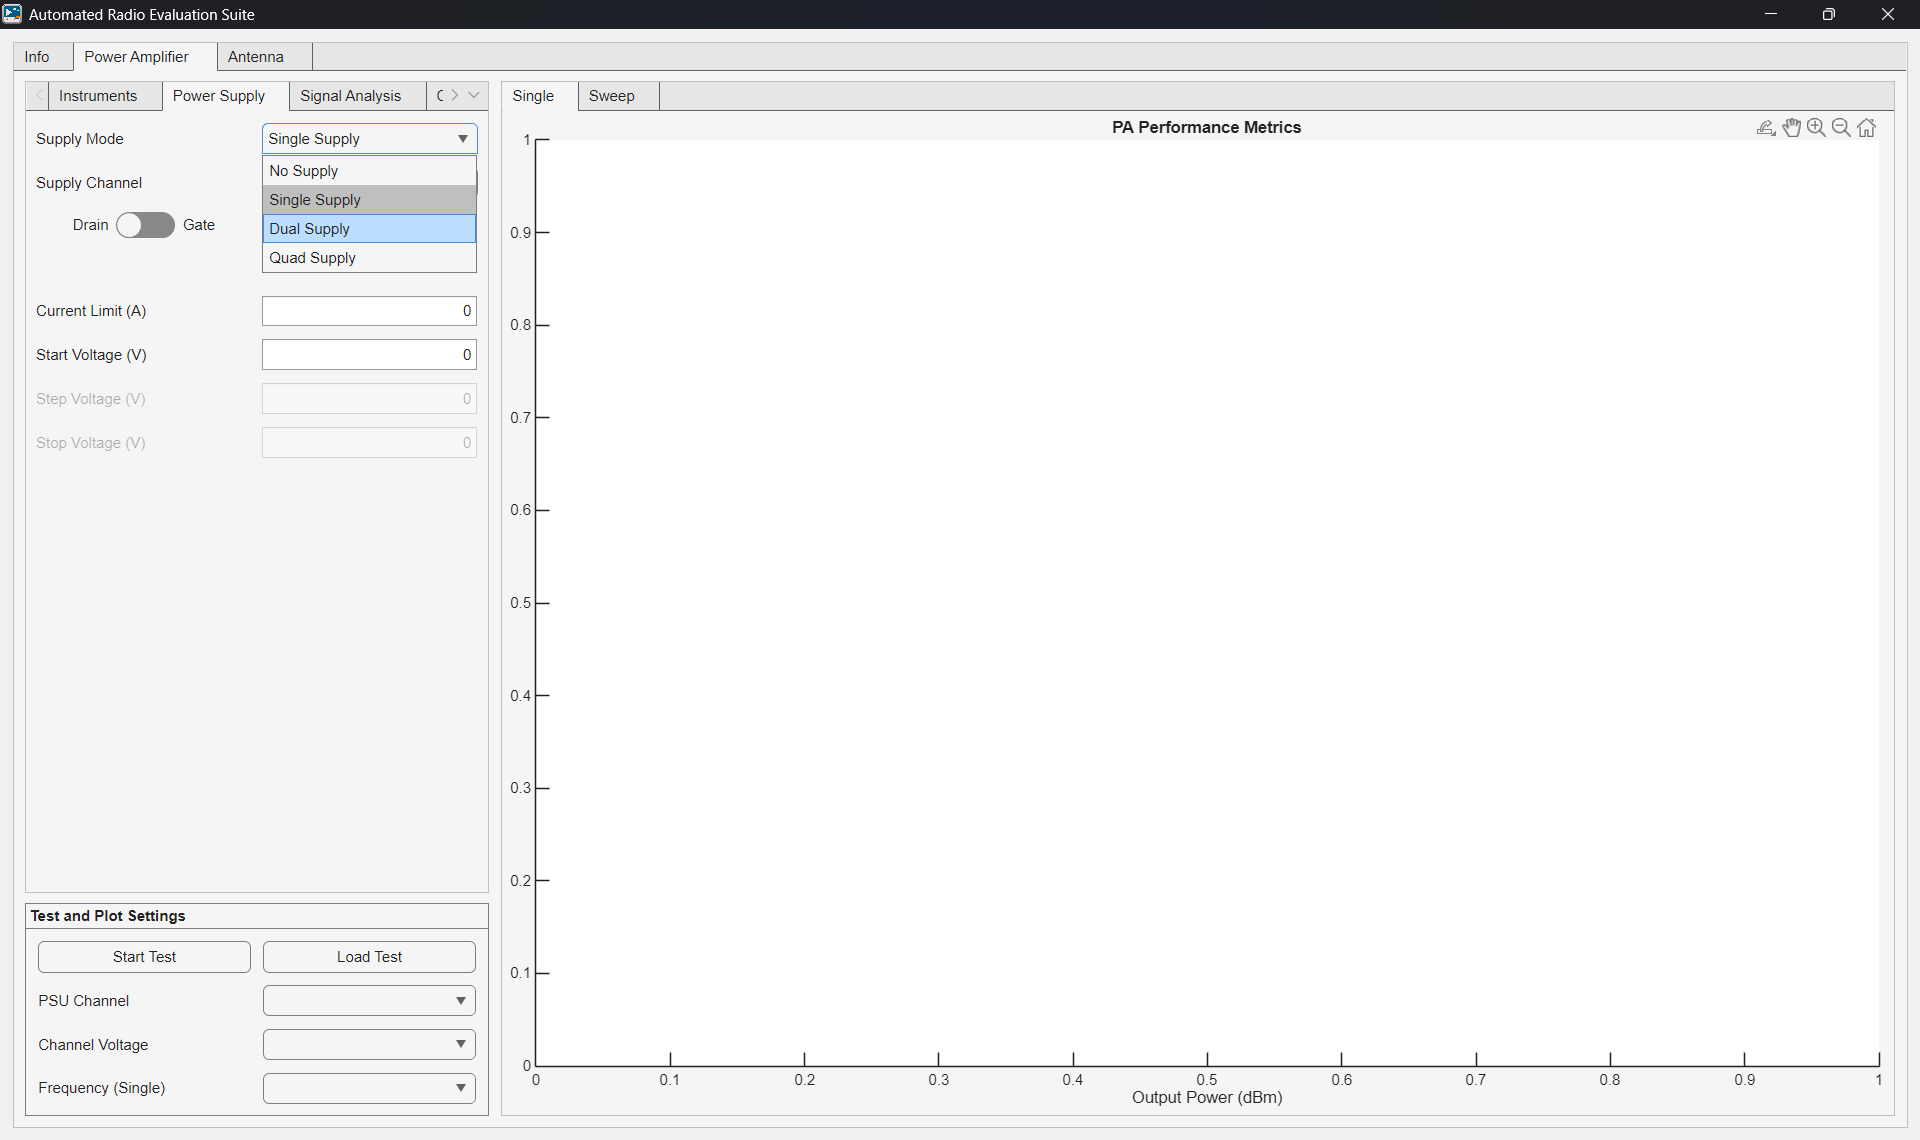
Set up the DC Power Supplies (PSUs) in the Power Supply tab. First, choose the appropriate Supply Mode based on the number of PSUs connected via the Instruments tab. ARES supports up to two dual-output PSUs. The available supply modes are:
No Supply: No control or measurement of any power supply, even if connected.
Single Supply: Uses a single output of one PSU.
Dual Supply: Uses two outputs from one or two PSUs.
Quad Supply: Uses all four outputs from two dual-output PSUs.
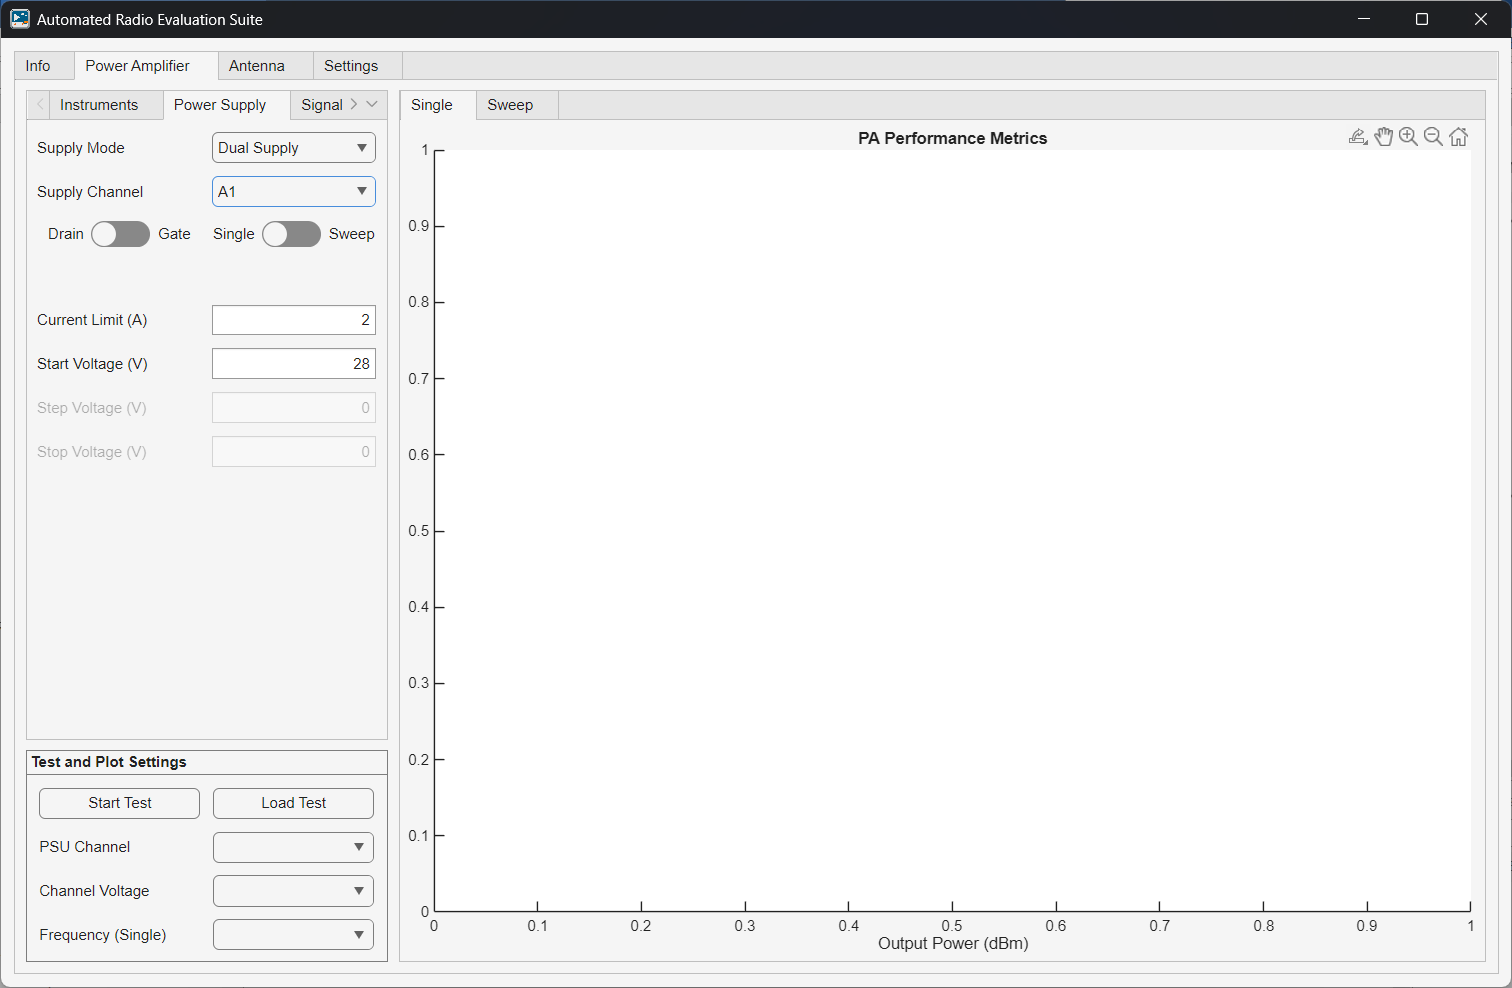
Each supply output is labeled with a supply name (A or B) and an output number (1 or 2). Use the Supply Channel dropdown to configure each output:
Assign whether the output is for the drain or gate (for efficiency calculations).
Choose between a static or swept voltage setting.
For static outputs, set the Current Limit and the Start Voltage.
For swept outputs, also enter the Step Voltage and Stop Voltage.
Configure the Signal Generator and Analyzer
Set up the RF input signal in the Signal Analysis tab.
Select the Measurement Type — choose between Single or Swept Frequencies in the dropdown.
In the Signal Generator Settings Section:
Define the frequency sweep (if applicable) by filling out the Start Frequency, Step Frequency, and Stop Frequency according to the measurement type.
Define the RF input power sweep by filling out the Start Power, Step Power, and Stop Power.
Caution
These settings are limited to the capabilities of the instruments (i.e., frequency and power range).
In the Signal Analyzer Settings Section:
Define an appropiate Span.
Define the number of Sweep Points.
Define the Reference Level as needed.
Default values should be feasible for most constant-wave (CW) measurements. The app will automatically change the center frequency of the signal analyzer to the same frequency as the signal generator.

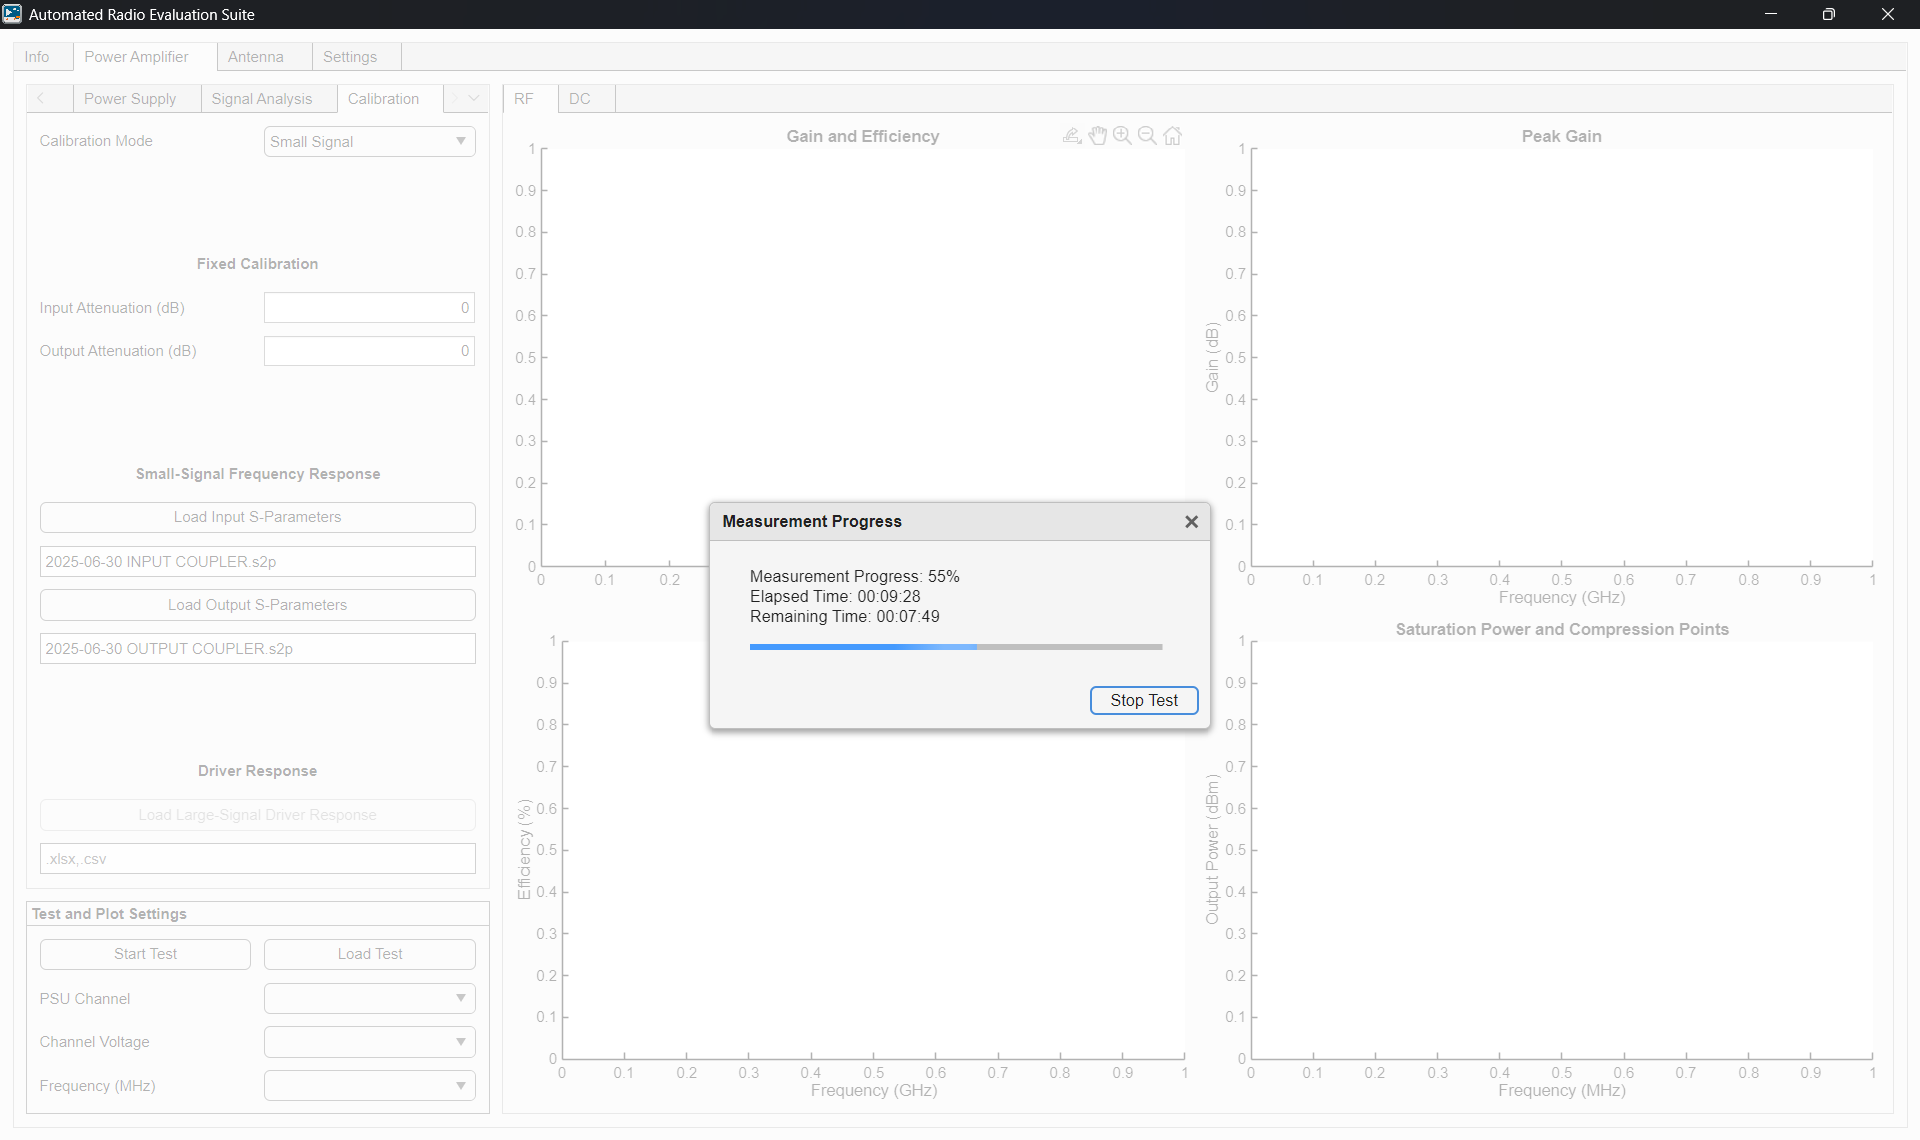
Configure the Measurement Calibration
The Calibration tab allows you to optionally account for attenuation and external gain stages.
Use the Calibration Mode dropdown to choose one of the following options:
None: No calibration will be applied.
Fixed: Specify static input and output attenuation in decibels, which will be applied equally to all frequencies. Used for passives (i.e., cables, attenuators, etc.).
Small Signal: Load an s-parameter measurement (*.s2p file) for the input and output to specify a frequency-dependent attenuation. This is used for passives (i.e., cables, attenuators, etc.). The fixed attenuation options are still available, and they will be added to the s-parameter attenuations.
Large Signal: In addition to the small-signal calibration options, load a driver amplifier measurement following the same data format in the app. The DUT input power will be calculated by adding the input attenuation and grabbing the output power of the driver at this input power and frequency. Intermediary values are linearly interpolated.

Run the Test and Plot the Results
After verifying all configuration settings, click Start Test to begin the measurement.
During the test:
A progress window will show elapsed time and estimated completion time.
To terminate the test, press the Stop Test button on the progress window.
Once the test is finished, a prompt will appear to save the results.
After saving your results:
The measurement data is automatically loaded and visualized by ARES.
To view previous results, use the Load Test button.
Single Frequency Results
In the Single results view window, use the Frequency and PSU Channel dropdowns to select which voltage configuration and channel to plot. This view shows gain, efficiency, and compression points for the selected parameters.

Sweep Frequencies Results
The Sweep results view window displays all gain curves, peak gain, efficiency, and compression points across all measured frequencies. Right-click on any plot to export it in the preferred format.
